University of North Carolina at Chapel Hill
School of Information and Library Science
INLS 184 - Protocols and Network Management
Team: Alberti, Eberline, Madariage, Yi
Network Traffic
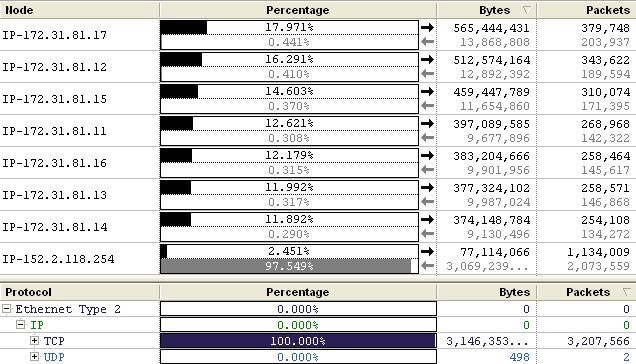
Our traffic data is skewed slightly by our number 3 scan (Apr 25th 1 - 1:15). This period showed an excessive amount of HTTP traffic between dhcp2002254.dhcp.unc.edu [152.2.118.254] and a webserver with multiple IP addresses [172.31.81.11 -> 17]. We tried connecting to this webserver and it asks for authentication to axview. As we limited our packet size to 68 bytes we are not sure what data was being passed, however their conversations monopolized most of the communications during that period. Approximately 80% of the traffic that was sent or received during that period was between these machines:
Excluding the exchange above, most of the traffic in our scans came from the following:
| Source Node | Destination Node |
|
wabac.soe.unc.edu [152.2.151.74] |
bicycle.soe.unc.edu
[152.2.90.251] |
|
UNIVERSITY OF MARYLAND [128.8.168.168 |
videoservices-codec1.its.unc.edu
[152.2.61.62] UDP Traffic - Used Netsight to find out that this is a video conferencing device |
|
wabac.soe.unc.edu [152.2.151.74] |
eacapel-818tc.depts.unc.edu
[152.2.77.66] |
|
horizon.soe.unc.edu [152.2.151.111] Horizon is a public website for incorporating technology into public education - not part of the school of education |
webgoogle0.isis.unc.edu
[152.2.2.140] This seems like a google appliance. |
|
PERFORMANCE SYSTEMS INTERNATIONAL INC
[38.119.36.38] |
jazz.soe.unc.edu
[152.2.90.224] |
|
TASKSTREAM LLC
(New York, NY) [209.10.173.33] |
rap.soe.unc.edu
[152.2.90.228] |
|
** Using IP2Location, a database of IP addresses and their geographic location, we were able to find the source of the Internet addresses accessing the school of education servers |
|
Protocol Distribution
As you can see from the chart below, the overwhelming majority of traffic was HTTP. A lot of this HTTP traffic was created by our 3rd scan which was mid-day. If you eliminate Scan 3, then the overall HTTP traffic percentage is reduced to about 65%, which is more in line with what we would expect given the times of the other scans.
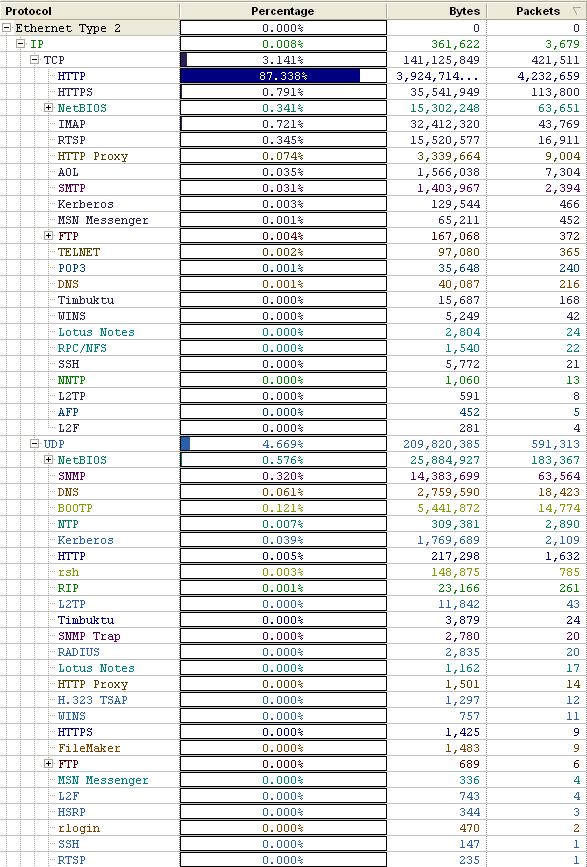
In addition to the HTTP traffic above, there were significant amounts of UDP traffic. A good portion of the UDP traffic was NetBIOS and SNMP, however there was a significant number of machines [dhcp*.wireless.unc.edu] using Multicast DNS (Based on UDP). These machines were probably Apple computers accessing the network wirelessly.
Monitoring ICMP traffic we found that soe889.dhcp.unc.edu [152.2.77.127] repeatedly received destination unreachable errors when sending packets to uni02f.unity.ncsu.edu [152.2.1.50]. Beyond that ICMP traffic appeared to be normal with intermittent destination unreachable errors.
Broadcast Packets
Beyond the MDNS traffic mentioned above, the majority of the broadcast traffic consisted of BOOTP traffic and ARP requests.
ICMP Packets
Within the packets we captured, ICMP Packets make up about 0.17% of the total IP packets and about 0.038% of the total bytes. Of these packets, five types of ICMP showed up in our captures. These include Destination Unreachable (12.25%), Echo Request & Reply (86.95%), Router Solicitation (0.15%) and Time-to-live Exceeded (0.65%). Overall, there is nothing unusual in terms of the volume and distribution of these ICMP packets.
Statistics:
| Total Packets: | 6,773,514 |
Packet Breakdown: 1,376 Destination Unreachable 17 Router Solicitation 73 Time-to-live Exceeded 9,768 Echo Request & Reply |
| ICMP Packets: | 11,234 | |
| Percentage: | 0.17% | |
| Total Bytes: | 4,448,047,567 | |
| ICMP Bytes: | 1,702,532 | |
| Percentage | 0.038% |
Other Traffic
We found evidence that the Manolito protocol, a popular file sharing protocol (http://www.piolet.com/protocol.htm), was being used on some machines accessing the School of Education network via wireless. Filtering based on the address we were able to see all of the protocol communications. However, because the packet sizes were small and not very numerous, it doesn't appear that the machine using the file sharing software was transferring any files.
In addition there was a significant amount of IPX and evidence of some AppleTalk traffic.
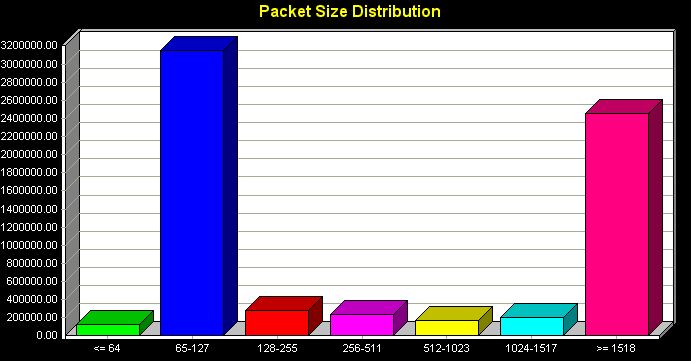
Packet Size
The overall packet size distribution was what we expected. The most packets were in the small size starting at 65 bytes. This is due mostly to an abundance of quick, short messages such as ARPs and DNS lookups. Since most of our traffic was HTTP, there were also a lot of larger packets which would be used during file transfer.
InterMapper Analysis
Chart 1 shows very normal traffic patterns for an uplink connection staying steady for the most part around 1% utilization except for one exceptionally large anomaly. Starting at around 12 p.m. Thursday, April 27 lasting until around 11 p.m. a very large traffic spike occurred. This spike probably averaged 3% utilization. During this period there were also two small extreme spikes with utilization hitting nearly 10% at 3 p.m. and 6% at 7 p.m. The cause of this anomaly is unknown to us. We hypothesize that it is either the School of Education utilizing its video conferencing system or a large period of file transfer. The percent error remained constant at zero, even when experiencing traffic spikes.
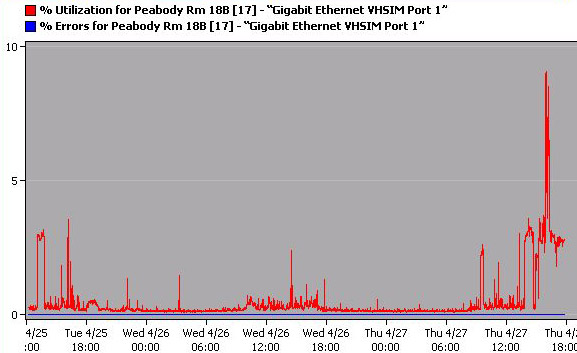
Chart 2 shows very normal traffic patterns for the uplink connection as well. The bytes being uploaded and downloaded stay very constant, averaging around 2 million bytes each until the traffic spike indicated in chart 1. Outgoing bytes per second peaked especially high during this period averaging around 4 million bytes per second. Two large spikes were recorded as well with one peaking at around 11 million bytes per second around 3 p.m. and the other peaking at 6 million bytes per second around 7 p.m. Incoming bytes per second increased, but not nearly as much as outgoing bytes per second. Incoming averaged around 2 million bytes per second during this active period. Data was being pushed out at a high rate for quite an extended time during the peak, yet even with a high utilization and a high upload rate no errors were seen.
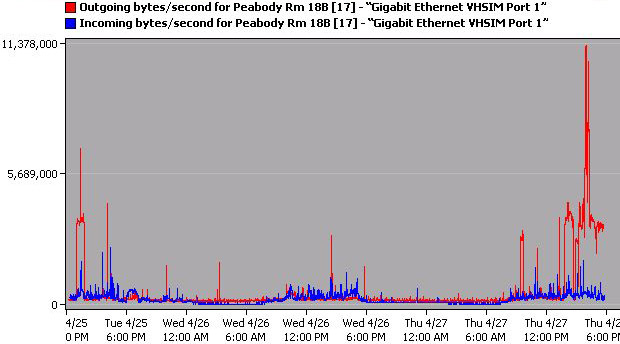
Chart 3 shows very normal traffic patterns averaging around 0.5% utilization with two exceptions. These exceptions occur at 5 p.m., Wednesday, April 26 and 12 p.m., Thursday, April 27 averaging 4% utilization for about an hour. With two small anomalies and an otherwise low utilization, port 5 had an error percentage of zero.
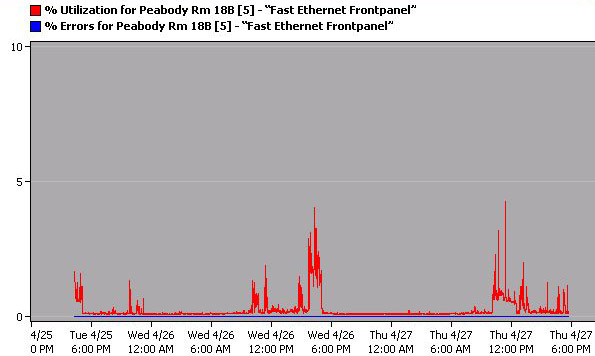
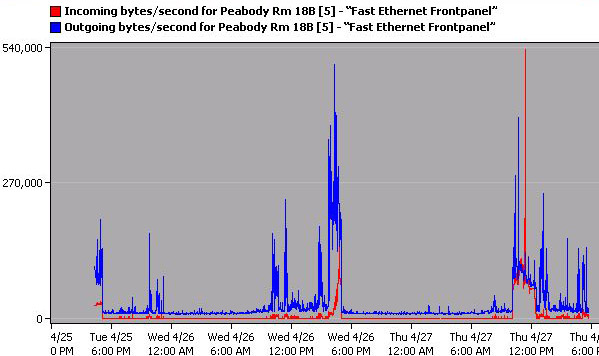
Chart 4 showed the same network consistency with the exception of two periods of high incoming bytes occurring at the same time as chart 3 indicated. This may be indicative of small periods of slightly heavy downloading for two one hour periods.
According to InterMapper, the machine horizon.soe.unc.edu is the busiest machine in Peabody. Horizon is a web server used to serve up the Horizon Site, an informational site for educators about the challenges that they will face in a changing world. Throughout our monitoring, Horizon both received and sent more packets than any other static IP.
NetSight Element Manager Analysis
The most important port to examine within Element Manager was the uplink (port 17, 172.29.220.21). This port runs at 1000 MB in full duplex mode, with automatic flow control. The port sees a 3:1 ratio of broadcast to multicast traffic and experiences no errors. The uplink deals most frequently with packets in the size range of 1024-1518 bytes and least frequently with packets 64 bytes long. This would make sense given that most of the traffic on the network is web browsing and downloading. The ports for all switches have been online and monitored for the past 402 days.